Teaching middle schoolers to estimate and compare irrational numbers often feels like pulling teeth. Students want exact answers, but square roots like √22 do not have clean decimals. A solid comparing rational approximations of square roots lesson plan bridges this gap. It helps students build real number sense by showing them how to trap an irrational number between two perfect squares, estimate its decimal value, and plot it accurately on a number line.
What does comparing rational approximations actually mean?
At its core, this topic asks students to figure out where an irrational number lives on the number line relative to rational numbers. Since they cannot write out the infinite, non-repeating decimals of an irrational number, they have to approximate. For example, to estimate √22, a student identifies that 22 falls between the perfect squares 16 and 25. Therefore, √22 falls between 4 and 5. Because 22 is closer to 25 than to 16, the square root is closer to 5, making a reasonable approximation 4.7. Students then compare this 4.7 to other rational numbers, like 4.5 or 9/2, using inequality symbols.
How do you introduce estimating irrational square roots?
Start with what they already know. Ask the class to list perfect squares up to 100 or even 144. Once they have that foundation memorized, you can introduce a quick warm-up activity on estimation strategies to get them thinking about the numbers that fall in the cracks. Show them that √10 is just a bit more than 3, and √8 is just a bit less than 3. Keep the initial numbers small and close to perfect squares so the mental math stays manageable.
Where do students usually get stuck?
Watch out for a few specific errors when students first try this on their own:
- Dividing by two: Many students see √20 and immediately write 10, confusing square roots with halving a number.
- Linear interpolation errors: Students often assume the distance between 4 and 5 on the number line is perfectly proportional to the distance between 16 and 25, ignoring the curve of the square root function. This leads to slight overestimations or underestimations.
- Plotting the radicand: A student might correctly calculate that √12 is approximately 3.4, but then plot the number 12 on the number line instead of 3.4.
How should you structure the core lesson?
Break the class period into clear, manageable segments. I usually rely on a structured guide for comparing rational approximations to keep the pacing tight. First, do guided practice where the class estimates three or four square roots together on the whiteboard. Next, move to number line plotting. Hand out a number line from 0 to 10 and have them place values like √12, √27, and 5.5. Finally, have them write inequalities to compare the plotted values, such as √12 < 5.5.
What kind of practice works best for independent work?
Worksheets with fifty identical problems cause burnout and mindless guessing. Mix up the question types. Give them a set of challenge problems for independent practice that require higher-order thinking. Ask them to find an irrational number that falls exactly between 3.1 and 3.2, or have them correct a fictional student's flawed number line. Word problems that involve real-world contexts, like estimating the side length of a square garden with an area of 40 square feet, also help cement the concept.
How can you make the lesson visually engaging?
The visual layout of your handouts matters more than you might think. If your worksheets are cluttered, students will give up before they even read the first question. Using a clean, readable typeface like Fredoka for your headings and providing large, clear number lines makes the material much less intimidating. Leave plenty of white space around the number lines so students have room to write out their perfect square brackets and show their work without scribbling over the axis.
What should students do when they finish early?
Always have an extension ready for the kids who breeze through the independent practice. You can have them use a calculator to check their manual approximations and calculate the percent error of their estimates. Alternatively, introduce the concept of cube roots and ask them to apply the exact same estimation logic to find the cube root of 30. This keeps them engaged without requiring you to pull out an entirely new lesson.
Teacher prep checklist for tomorrow's class
- Print number lines that span from at least 0 to 12, ensuring the tick marks are spaced far enough apart for students to plot multiple points.
- Write a list of the first 15 perfect squares on the board or a poster so students can reference it without asking you every two minutes.
- Prepare three "trap" questions for the guided practice where the radicand is exactly halfway between two perfect squares (like √20.5) to spark a debate about rounding.
- Have calculators available at the end of the lesson strictly for the self-checking phase, not for the initial estimation phase.
 Root Finders: the Estimation Game Center
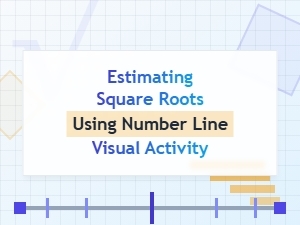 Visualizing Square Roots on a Number Line
 Estimating Square Roots Through Rational Approximations
 Warm-Up Strategies for Estimating Irrational Square Roots
 Mental Math Tricks for Estimating Square Roots
 A Simple Geometric Model for Estimating Square Roots